Data
444,593 items of data are available, covering 431,223 participants.
Defined-instances run from 0 to 1, labelled using Instancing
2.
Units of measurement are mmol/L.
| Maximum | 4.702 |
| Decile 9 | 1.363 |
| Decile 8 | 1.2955 |
| Decile 7 | 1.247 |
| Decile 6 | 1.205 |
| Median | 1.165 |
| Decile 4 | 1.125 |
| Decile 3 | 1.081 |
| Decile 2 | 1.028 |
| Decile 1 | 0.954 |
| Minimum | 0.369 |
|
|
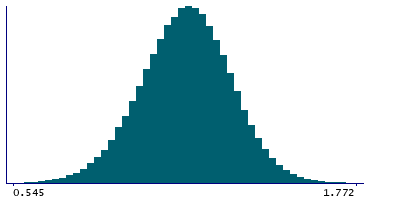
- Mean = 1.16173
- Std.dev = 0.161478
- 71 items below graph minimum of 0.545
- 116 items above graph maximum of 1.772
|
2 Instances
Instance 0 : Initial assessment visit (2006-2010) at which participants were recruited and consent given
428,951 participants, 428,951 items
| Maximum | 4.702 |
| Decile 9 | 1.36 |
| Decile 8 | 1.293 |
| Decile 7 | 1.244 |
| Decile 6 | 1.202 |
| Median | 1.162 |
| Decile 4 | 1.122 |
| Decile 3 | 1.078 |
| Decile 2 | 1.026 |
| Decile 1 | 0.952 |
| Minimum | 0.369 |
|

|
- Mean = 1.15934
- Std.dev = 0.16111
- 67 items below graph minimum of 0.544
- 115 items above graph maximum of 1.768
|
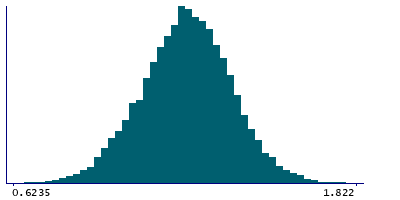
Instance 1 : First repeat assessment visit (2012-13)
15,642 participants, 15,642 items
| Maximum | 1.907 |
| Decile 9 | 1.4225 |
| Decile 8 | 1.358 |
| Decile 7 | 1.31 |
| Decile 6 | 1.269 |
| Median | 1.23 |
| Decile 4 | 1.193 |
| Decile 3 | 1.149 |
| Decile 2 | 1.098 |
| Decile 1 | 1.023 |
| Minimum | 0.423 |
|
|
- Mean = 1.22745
- Std.dev = 0.157665
- 5 items below graph minimum of 0.6235
- 5 items above graph maximum of 1.822
|
Notes
Measured by phophomolybdate complex analysis on a Beckman Coulter AU5800
0 Related Data-Fields
There are no related data-fields

