Data
484,198 items of data are available, covering 467,858 participants.
Defined-instances run from 0 to 1, labelled using Instancing
2.
Units of measurement are nmol/L.
| Maximum | 126.766 |
| Decile 9 | 28.4 |
| Decile 8 | 25.731 |
| Decile 7 | 23.99 |
| Decile 6 | 22.563 |
| Median | 21.23 |
| Decile 4 | 19.833 |
| Decile 3 | 18.324 |
| Decile 2 | 16.595 |
| Decile 1 | 14.338 |
| Minimum | 1.445 |
|

|
- Mean = 21.3819
- Std.dev = 5.69427
- 992 items above graph maximum of 42.462
|
2 Instances
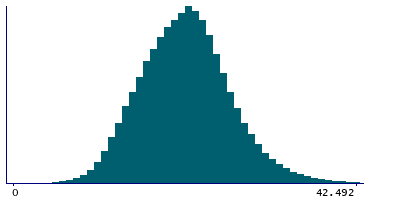
Instance 0 : Initial assessment visit (2006-2010) at which participants were recruited and consent given
466,518 participants, 466,518 items
| Maximum | 126.766 |
| Decile 9 | 28.419 |
| Decile 8 | 25.752 |
| Decile 7 | 24.009 |
| Decile 6 | 22.58 |
| Median | 21.246 |
| Decile 4 | 19.848 |
| Decile 3 | 18.339 |
| Decile 2 | 16.607 |
| Decile 1 | 14.345 |
| Minimum | 1.445 |
|
|
- Mean = 21.398
- Std.dev = 5.69974
- 949 items above graph maximum of 42.493
|
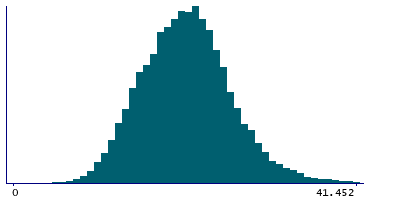
Instance 1 : First repeat assessment visit (2012-13)
17,680 participants, 17,680 items
| Maximum | 90.084 |
| Decile 9 | 27.802 |
| Decile 8 | 25.18 |
| Decile 7 | 23.507 |
| Decile 6 | 22.11 |
| Median | 20.793 |
| Decile 4 | 19.435 |
| Decile 3 | 17.97 |
| Decile 2 | 16.253 |
| Decile 1 | 14.147 |
| Minimum | 2.389 |
|
|
- Mean = 20.9563
- Std.dev = 5.531
- 42 items above graph maximum of 41.457
|
Notes
Measured by CLIA analysis on a DiaSorin Ltd. LIASON XL
0 Related Data-Fields
There are no related data-fields

