Data
486,719 items of data are available, covering 470,126 participants.
Defined-instances run from 0 to 1, labelled using Instancing
2.
Units of measurement are U/L.
| Maximum | 495.19 |
| Decile 9 | 37.73 |
| Decile 8 | 29.74 |
| Decile 7 | 25.45 |
| Decile 6 | 22.47 |
| Median | 20.13 |
| Decile 4 | 18.15 |
| Decile 3 | 16.32 |
| Decile 2 | 14.5 |
| Decile 1 | 12.35 |
| Minimum | 3.01 |
|

|
- Mean = 23.5265
- Std.dev = 14.1134
- 8840 items above graph maximum of 63.11
|
2 Instances
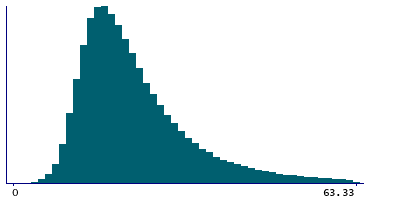
Instance 0 : Initial assessment visit (2006-2010) at which participants were recruited and consent given
468,874 participants, 468,874 items
| Maximum | 495.19 |
| Decile 9 | 37.83 |
| Decile 8 | 29.79 |
| Decile 7 | 25.48 |
| Decile 6 | 22.48 |
| Median | 20.13 |
| Decile 4 | 18.14 |
| Decile 3 | 16.3 |
| Decile 2 | 14.48 |
| Decile 1 | 12.33 |
| Minimum | 3.01 |
|
|
- Mean = 23.5469
- Std.dev = 14.1826
- 8525 items above graph maximum of 63.33
|
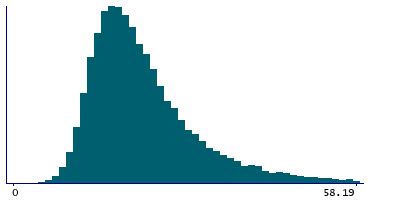
Instance 1 : First repeat assessment visit (2012-13)
17,845 participants, 17,845 items
| Maximum | 252.29 |
| Decile 9 | 35.57 |
| Decile 8 | 28.55 |
| Decile 7 | 24.83 |
| Decile 6 | 22.25 |
| Median | 20.17 |
| Decile 4 | 18.37 |
| Decile 3 | 16.69 |
| Decile 2 | 14.98 |
| Decile 1 | 12.96 |
| Minimum | 3.47 |
|
|
- Mean = 22.9906
- Std.dev = 12.1428
- 314 items above graph maximum of 58.18
|
Notes
Measured by IFCC analysis on a Beckman Coulter AU5800
0 Related Data-Fields
There are no related data-fields

