Data
445,463 items of data are available, covering 432,037 participants.
Defined-instances run from 0 to 1, labelled using Instancing
2.
Units of measurement are g/L.
| Maximum | 59.8 |
| Decile 9 | 48.54 |
| Decile 8 | 47.38 |
| Decile 7 | 46.55 |
| Decile 6 | 45.85 |
| Median | 45.21 |
| Decile 4 | 44.57 |
| Decile 3 | 43.88 |
| Decile 2 | 43.08 |
| Decile 1 | 41.95 |
| Minimum | 17.38 |
|

|
- Mean = 45.2247
- Std.dev = 2.62936
- 400 items below graph minimum of 35.36
- 168 items above graph maximum of 55.13
|
2 Instances
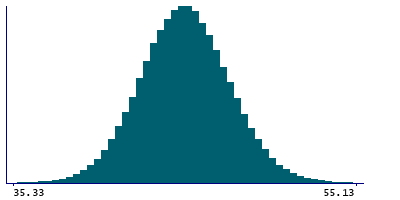
Instance 0 : Initial assessment visit (2006-2010) at which participants were recruited and consent given
429,776 participants, 429,776 items
| Maximum | 59.8 |
| Decile 9 | 48.53 |
| Decile 8 | 47.36 |
| Decile 7 | 46.53 |
| Decile 6 | 45.84 |
| Median | 45.2 |
| Decile 4 | 44.55 |
| Decile 3 | 43.86 |
| Decile 2 | 43.06 |
| Decile 1 | 41.93 |
| Minimum | 17.38 |
|
|
- Mean = 45.2099
- Std.dev = 2.62912
- 381 items below graph minimum of 35.33
- 155 items above graph maximum of 55.13
|
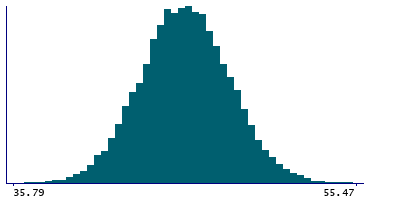
Instance 1 : First repeat assessment visit (2012-13)
15,687 participants, 15,687 items
| Maximum | 59.3 |
| Decile 9 | 48.91 |
| Decile 8 | 47.78 |
| Decile 7 | 46.96 |
| Decile 6 | 46.27 |
| Median | 45.62 |
| Decile 4 | 44.95 |
| Decile 3 | 44.28 |
| Decile 2 | 43.5 |
| Decile 1 | 42.35 |
| Minimum | 31.1 |
|
|
- Mean = 45.6299
- Std.dev = 2.6035
- 11 items below graph minimum of 35.79
- 7 items above graph maximum of 55.47
|
Notes
Measured by BCG analysis on a Beckman Coulter AU5800
0 Related Data-Fields
There are no related data-fields

