Data
51,610 items of data are available, covering 46,924 participants.
Defined-instances run from 2 to 3, labelled using Instancing
2.
Units of measurement are mm.
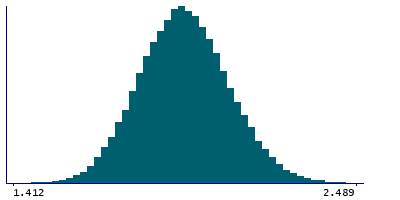
| Maximum | 2.843 |
| Decile 9 | 2.129 |
| Decile 8 | 2.064 |
| Decile 7 | 2.02 |
| Decile 6 | 1.982 |
| Median | 1.946 |
| Decile 4 | 1.911 |
| Decile 3 | 1.873 |
| Decile 2 | 1.831 |
| Decile 1 | 1.772 |
| Minimum | 1.4 |
|
|
- Mean = 1.94882
- Std.dev = 0.139763
- 2 items below graph minimum of 1.415
- 15 items above graph maximum of 2.486
|
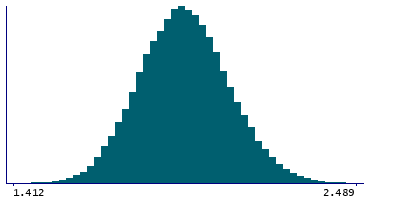
2 Instances
Instance 2 : Imaging visit (2014+)
46,852 participants, 46,852 items
| Maximum | 2.796 |
| Decile 9 | 2.129 |
| Decile 8 | 2.064 |
| Decile 7 | 2.02 |
| Decile 6 | 1.982 |
| Median | 1.946 |
| Decile 4 | 1.912 |
| Decile 3 | 1.873 |
| Decile 2 | 1.831 |
| Decile 1 | 1.772 |
| Minimum | 1.4 |
|
|
- Mean = 1.94884
- Std.dev = 0.139745
- 2 items below graph minimum of 1.415
- 13 items above graph maximum of 2.486
|
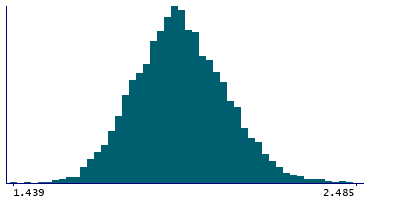
Instance 3 : First repeat imaging visit (2019+)
4,758 participants, 4,758 items
| Maximum | 2.843 |
| Decile 9 | 2.129 |
| Decile 8 | 2.065 |
| Decile 7 | 2.016 |
| Decile 6 | 1.978 |
| Median | 1.943 |
| Decile 4 | 1.911 |
| Decile 3 | 1.874 |
| Decile 2 | 1.83 |
| Decile 1 | 1.773 |
| Minimum | 1.439 |
|
|
- Mean = 1.9486
- Std.dev = 0.139936
- 2 items above graph maximum of 2.485
|
Notes
Mean thickness of cuneus in the right hemisphere generated by parcellation of the white surface using DKT parcellation
0 Related Data-Fields
There are no related data-fields
0 Resources
There are no matching Resources
