Data
51,610 items of data are available, covering 46,924 participants.
Defined-instances run from 2 to 3, labelled using Instancing
2.
Units of measurement are mm.
| Maximum | 3.44 |
| Decile 9 | 3.026 |
| Decile 8 | 2.957 |
| Decile 7 | 2.905 |
| Decile 6 | 2.859 |
| Median | 2.815 |
| Decile 4 | 2.767 |
| Decile 3 | 2.713 |
| Decile 2 | 2.645 |
| Decile 1 | 2.544 |
| Minimum | 1.448 |
|
|
- Mean = 2.79668
- Std.dev = 0.191118
- 56 items below graph minimum of 2.062
|
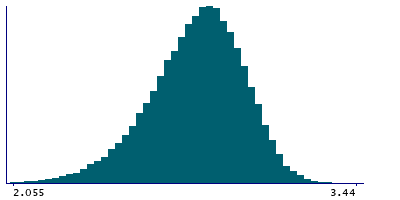
2 Instances
Instance 2 : Imaging visit (2014+)
46,852 participants, 46,852 items
| Maximum | 3.44 |
| Decile 9 | 3.025 |
| Decile 8 | 2.956 |
| Decile 7 | 2.904 |
| Decile 6 | 2.858 |
| Median | 2.814 |
| Decile 4 | 2.765 |
| Decile 3 | 2.711 |
| Decile 2 | 2.644 |
| Decile 1 | 2.542 |
| Minimum | 1.658 |
|

|
- Mean = 2.79559
- Std.dev = 0.191491
- 50 items below graph minimum of 2.059
|
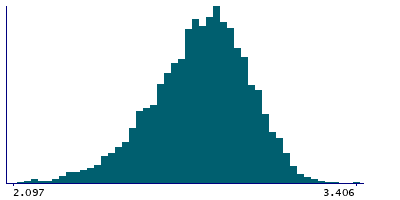
Instance 3 : First repeat imaging visit (2019+)
4,758 participants, 4,758 items
| Maximum | 3.406 |
| Decile 9 | 3.033 |
| Decile 8 | 2.965 |
| Decile 7 | 2.913 |
| Decile 6 | 2.869 |
| Median | 2.824 |
| Decile 4 | 2.778 |
| Decile 3 | 2.725 |
| Decile 2 | 2.66 |
| Decile 1 | 2.565 |
| Minimum | 1.448 |
|
|
- Mean = 2.80746
- Std.dev = 0.187058
- 8 items below graph minimum of 2.097
|
Notes
Mean thickness of precentral in the left hemisphere generated by parcellation of the white surface using Desikan-Killiany parcellation
0 Related Data-Fields
There are no related data-fields
0 Resources
There are no matching Resources
