Data
51,610 items of data are available, covering 46,924 participants.
Defined-instances run from 2 to 3, labelled using Instancing
2.
Units of measurement are mm3.
| Maximum | 786.353 |
| Decile 9 | 293.194 |
| Decile 8 | 278.855 |
| Decile 7 | 268.923 |
| Decile 6 | 261.05 |
| Median | 253.961 |
| Decile 4 | 247.102 |
| Decile 3 | 240.078 |
| Decile 2 | 231.867 |
| Decile 1 | 221.148 |
| Minimum | 105.523 |
|
|
- Mean = 256.031
- Std.dev = 29.225
- 4 items below graph minimum of 149.102
- 104 items above graph maximum of 365.239
|
2 Instances
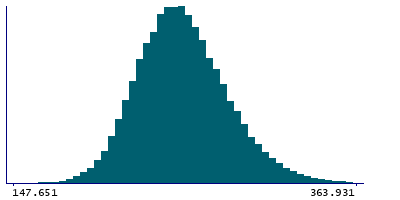
Instance 2 : Imaging visit (2014+)
46,852 participants, 46,852 items
| Maximum | 786.353 |
| Decile 9 | 293.141 |
| Decile 8 | 278.941 |
| Decile 7 | 269.026 |
| Decile 6 | 261.194 |
| Median | 254.073 |
| Decile 4 | 247.199 |
| Decile 3 | 240.103 |
| Decile 2 | 231.831 |
| Decile 1 | 221.17 |
| Minimum | 105.523 |
|

|
- Mean = 256.096
- Std.dev = 29.1772
- 3 items below graph minimum of 149.199
- 93 items above graph maximum of 365.112
|
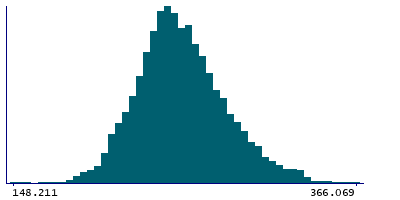
Instance 3 : First repeat imaging visit (2019+)
4,758 participants, 4,758 items
| Maximum | 566.454 |
| Decile 9 | 293.45 |
| Decile 8 | 277.927 |
| Decile 7 | 267.753 |
| Decile 6 | 259.835 |
| Median | 252.507 |
| Decile 4 | 246.149 |
| Decile 3 | 239.789 |
| Decile 2 | 232.179 |
| Decile 1 | 220.83 |
| Minimum | 127.067 |
|
|
- Mean = 255.396
- Std.dev = 29.6839
- 1 item below graph minimum of 148.211
- 11 items above graph maximum of 366.069
|
Notes
Volume of MDl in the left hemisphere generated by subcortical volumetric sub-segmentation of the Thalamic Nuclei
0 Related Data-Fields
There are no related data-fields
0 Resources
There are no matching Resources
