Data
51,610 items of data are available, covering 46,924 participants.
Defined-instances run from 2 to 3, labelled using Instancing
2.
Units of measurement are mm3.
| Maximum | 1839.53 |
| Decile 9 | 758.931 |
| Decile 8 | 725.292 |
| Decile 7 | 701.532 |
| Decile 6 | 681.199 |
| Median | 662.28 |
| Decile 4 | 643.511 |
| Decile 3 | 623.661 |
| Decile 2 | 600.402 |
| Decile 1 | 567.645 |
| Minimum | 290.688 |
|

|
- Mean = 663.207
- Std.dev = 75.6522
- 3 items below graph minimum of 376.359
- 32 items above graph maximum of 950.217
|
2 Instances
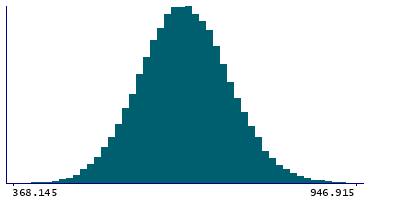
Instance 2 : Imaging visit (2014+)
46,852 participants, 46,852 items
| Maximum | 1839.53 |
| Decile 9 | 759.308 |
| Decile 8 | 725.694 |
| Decile 7 | 701.86 |
| Decile 6 | 681.475 |
| Median | 662.492 |
| Decile 4 | 643.683 |
| Decile 3 | 623.747 |
| Decile 2 | 600.32 |
| Decile 1 | 567.543 |
| Minimum | 290.688 |
|
|
- Mean = 663.375
- Std.dev = 75.6792
- 2 items below graph minimum of 375.777
- 27 items above graph maximum of 951.074
|
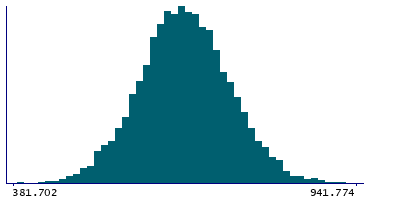
Instance 3 : First repeat imaging visit (2019+)
4,758 participants, 4,758 items
| Maximum | 1544.31 |
| Decile 9 | 755.083 |
| Decile 8 | 722.244 |
| Decile 7 | 698.988 |
| Decile 6 | 679.007 |
| Median | 660.456 |
| Decile 4 | 641.703 |
| Decile 3 | 622.607 |
| Decile 2 | 601.051 |
| Decile 1 | 568.28 |
| Minimum | 368.71 |
|
|
- Mean = 661.559
- Std.dev = 75.3656
- 1 item below graph minimum of 381.477
- 5 items above graph maximum of 941.887
|
Notes
Volume of MDm in the left hemisphere generated by subcortical volumetric sub-segmentation of the Thalamic Nuclei
0 Related Data-Fields
There are no related data-fields
0 Resources
There are no matching Resources
