Data
51,610 items of data are available, covering 46,924 participants.
Defined-instances run from 2 to 3, labelled using Instancing
2.
Units of measurement are mm3.
| Maximum | 6562.37 |
| Decile 9 | 4296.23 |
| Decile 8 | 4106.72 |
| Decile 7 | 3972.7 |
| Decile 6 | 3862.78 |
| Median | 3761.46 |
| Decile 4 | 3663.54 |
| Decile 3 | 3559.01 |
| Decile 2 | 3436.98 |
| Decile 1 | 3272.58 |
| Minimum | 1870.08 |
|
|
- Mean = 3774.59
- Std.dev = 405.878
- 13 items below graph minimum of 2248.93
- 26 items above graph maximum of 5319.88
|
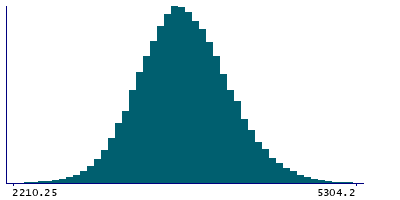
2 Instances
Instance 2 : Imaging visit (2014+)
46,852 participants, 46,852 items
| Maximum | 6562.37 |
| Decile 9 | 4296.37 |
| Decile 8 | 4105.59 |
| Decile 7 | 3971.77 |
| Decile 6 | 3861.72 |
| Median | 3760.91 |
| Decile 4 | 3662.54 |
| Decile 3 | 3557.17 |
| Decile 2 | 3435.57 |
| Decile 1 | 3271.86 |
| Minimum | 1870.08 |
|

|
- Mean = 3773.76
- Std.dev = 406.28
- 12 items below graph minimum of 2247.35
- 23 items above graph maximum of 5320.88
|
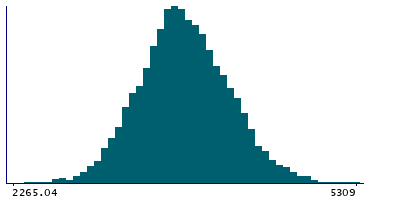
Instance 3 : First repeat imaging visit (2019+)
4,758 participants, 4,758 items
| Maximum | 5457.57 |
| Decile 9 | 4294.35 |
| Decile 8 | 4119.23 |
| Decile 7 | 3980.12 |
| Decile 6 | 3870.78 |
| Median | 3767.01 |
| Decile 4 | 3672.24 |
| Decile 3 | 3575.66 |
| Decile 2 | 3451.34 |
| Decile 1 | 3279.7 |
| Minimum | 2134.68 |
|
|
- Mean = 3782.72
- Std.dev = 401.802
- 2 items below graph minimum of 2265.04
- 3 items above graph maximum of 5309
|
Notes
Volume of Whole-hippocampus in the right hemisphere generated by subcortical volumetric sub-segmentation of the Hippocampal Subfields
0 Related Data-Fields
There are no related data-fields
0 Resources
There are no matching Resources
