Data
51,610 items of data are available, covering 46,924 participants.
Defined-instances run from 2 to 3, labelled using Instancing
2.
Units of measurement are mm3.
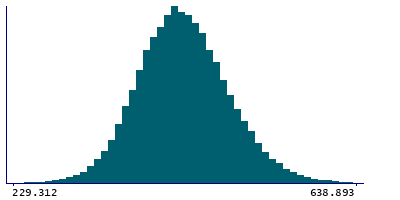
| Maximum | 706.082 |
| Decile 9 | 505.36 |
| Decile 8 | 479.1 |
| Decile 7 | 460.925 |
| Decile 6 | 446.4 |
| Median | 432.973 |
| Decile 4 | 419.898 |
| Decile 3 | 406.128 |
| Decile 2 | 390.25 |
| Decile 1 | 368.754 |
| Minimum | 198.221 |
|
|
- Mean = 435.202
- Std.dev = 54.0415
- 6 items below graph minimum of 232.148
- 27 items above graph maximum of 641.966
|
2 Instances
Instance 2 : Imaging visit (2014+)
46,852 participants, 46,852 items
| Maximum | 706.082 |
| Decile 9 | 505.46 |
| Decile 8 | 479.204 |
| Decile 7 | 461.023 |
| Decile 6 | 446.437 |
| Median | 432.977 |
| Decile 4 | 419.797 |
| Decile 3 | 406.031 |
| Decile 2 | 390.11 |
| Decile 1 | 368.676 |
| Minimum | 198.221 |
|

|
- Mean = 435.218
- Std.dev = 54.1473
- 5 items below graph minimum of 231.892
- 25 items above graph maximum of 642.244
|
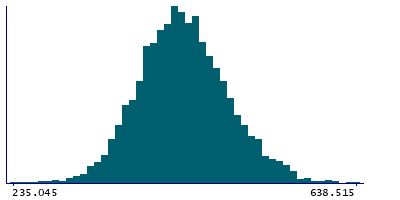
Instance 3 : First repeat imaging visit (2019+)
4,758 participants, 4,758 items
| Maximum | 644.093 |
| Decile 9 | 504.025 |
| Decile 8 | 477.946 |
| Decile 7 | 459.989 |
| Decile 6 | 446.039 |
| Median | 432.953 |
| Decile 4 | 420.757 |
| Decile 3 | 406.998 |
| Decile 2 | 391.42 |
| Decile 1 | 369.535 |
| Minimum | 203.501 |
|
|
- Mean = 435.045
- Std.dev = 52.9889
- 3 items below graph minimum of 235.045
- 2 items above graph maximum of 638.515
|
Notes
Volume of Basal-nucleus in the right hemisphere generated by subcortical volumetric sub-segmentation of the Amygdala Nuclei
0 Related Data-Fields
There are no related data-fields
0 Resources
There are no matching Resources
