Data
51,610 items of data are available, covering 46,924 participants.
Defined-instances run from 2 to 3, labelled using Instancing
2.
Units of measurement are AU.
| Maximum | 93.3004 |
| Decile 9 | 87.0556 |
| Decile 8 | 86.5101 |
| Decile 7 | 86.123 |
| Decile 6 | 85.7975 |
| Median | 85.4938 |
| Decile 4 | 85.1721 |
| Decile 3 | 84.8128 |
| Decile 2 | 84.3619 |
| Decile 1 | 83.7486 |
| Minimum | 51.8125 |
|
|
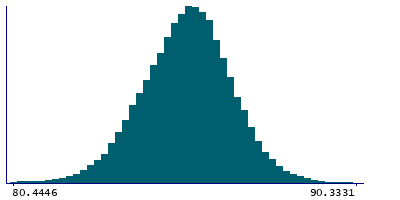
- Mean = 85.4302
- Std.dev = 1.37147
- 156 items below graph minimum of 80.4416
- 32 items above graph maximum of 90.3626
|
2 Instances
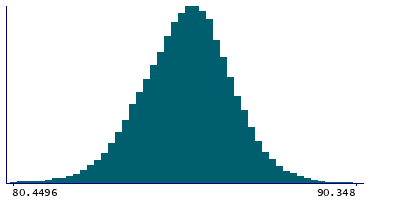
Instance 2 : Imaging visit (2014+)
46,852 participants, 46,852 items
| Maximum | 93.3004 |
| Decile 9 | 87.0782 |
| Decile 8 | 86.5301 |
| Decile 7 | 86.144 |
| Decile 6 | 85.8163 |
| Median | 85.5087 |
| Decile 4 | 85.1886 |
| Decile 3 | 84.8261 |
| Decile 2 | 84.3752 |
| Decile 1 | 83.7585 |
| Minimum | 51.8125 |
|
|
- Mean = 85.447
- Std.dev = 1.37405
- 136 items below graph minimum of 80.4389
- 31 items above graph maximum of 90.3978
|
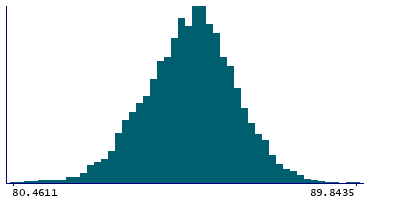
Instance 3 : First repeat imaging visit (2019+)
4,758 participants, 4,758 items
| Maximum | 89.8435 |
| Decile 9 | 86.8194 |
| Decile 8 | 86.3088 |
| Decile 7 | 85.945 |
| Decile 6 | 85.6248 |
| Median | 85.3489 |
| Decile 4 | 85.03 |
| Decile 3 | 84.6781 |
| Decile 2 | 84.2527 |
| Decile 1 | 83.6402 |
| Minimum | 64.9296 |
|
|
- Mean = 85.2648
- Std.dev = 1.33447
- 20 items below graph minimum of 80.4611
|
Notes
Mean intensity of Cerebellum-White-Matter in the right hemisphere generated by subcortical volumetric segmentation (aseg)
0 Related Data-Fields
There are no related data-fields
0 Resources
There are no matching Resources
