Data
51,610 items of data are available, covering 46,924 participants.
Defined-instances run from 2 to 3, labelled using Instancing
2.
Units of measurement are mm3.
| Maximum | 1394.5 |
| Decile 9 | 690.7 |
| Decile 8 | 608.8 |
| Decile 7 | 562.1 |
| Decile 6 | 527.7 |
| Median | 500 |
| Decile 4 | 474.9 |
| Decile 3 | 450 |
| Decile 2 | 423.7 |
| Decile 1 | 391.4 |
| Minimum | 69 |
|

|
- Mean = 523.554
- Std.dev = 124.511
- 251 items above graph maximum of 990
|
2 Instances
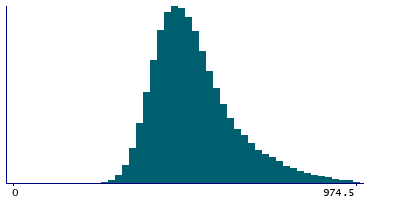
Instance 2 : Imaging visit (2014+)
46,852 participants, 46,852 items
| Maximum | 1394.5 |
| Decile 9 | 689.7 |
| Decile 8 | 608.3 |
| Decile 7 | 561.8 |
| Decile 6 | 527.3 |
| Median | 499.7 |
| Decile 4 | 474.6 |
| Decile 3 | 449.7 |
| Decile 2 | 423.7 |
| Decile 1 | 391.3 |
| Minimum | 69 |
|
|
- Mean = 523.158
- Std.dev = 124.364
- 232 items above graph maximum of 988.1
|
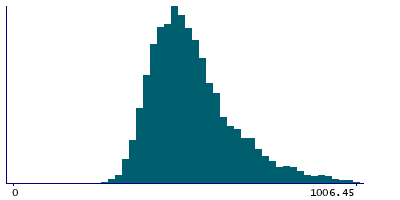
Instance 3 : First repeat imaging visit (2019+)
4,758 participants, 4,758 items
| Maximum | 1223.2 |
| Decile 9 | 699.3 |
| Decile 8 | 614.7 |
| Decile 7 | 566.35 |
| Decile 6 | 532.55 |
| Median | 503.7 |
| Decile 4 | 477.8 |
| Decile 3 | 452.5 |
| Decile 2 | 423.75 |
| Decile 1 | 392.15 |
| Minimum | 221.6 |
|
|
- Mean = 527.454
- Std.dev = 125.888
- 17 items above graph maximum of 1006.45
|
Notes
Volume of CC-Mid-Anterior in the whole brain generated by subcortical volumetric segmentation (aseg)
0 Related Data-Fields
There are no related data-fields
0 Resources
There are no matching Resources
