Data
44,766 items of data are available, covering 40,814 participants.
Defined-instances run from 2 to 3, labelled using Instancing
2.
Units of measurement are units.
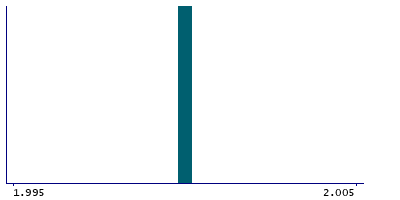
| Maximum | 6 |
| Decile 9 | 2 |
| Decile 8 | 2 |
| Decile 7 | 2 |
| Decile 6 | 2 |
| Median | 2 |
| Decile 4 | 2 |
| Decile 3 | 2 |
| Decile 2 | 2 |
| Decile 1 | 2 |
| Minimum | 1 |
|

|
- Mean = 1.98921
- Std.dev = 0.117475
- 511 items below graph minimum of 1.995
- 7 items above graph maximum of 2.005
|
2 Instances
Instance 2 : Imaging visit (2014+)
40,450 participants, 40,450 items
| Maximum | 6 |
| Decile 9 | 2 |
| Decile 8 | 2 |
| Decile 7 | 2 |
| Decile 6 | 2 |
| Median | 2 |
| Decile 4 | 2 |
| Decile 3 | 2 |
| Decile 2 | 2 |
| Decile 1 | 2 |
| Minimum | 1 |
|
|
- Mean = 1.98806
- Std.dev = 0.123528
- 511 items below graph minimum of 1.995
- 7 items above graph maximum of 2.005
|
Instance 3 : First repeat imaging visit (2019+)
4,316 participants, 4,316 items
Too few values for statistical summary.