Data
42,927 items of data are available, covering 39,064 participants.
Defined-instances run from 2 to 3, labelled using Instancing
2.
Units of measurement are percent.
| Maximum | 10.04 |
| Decile 9 | 2.96 |
| Decile 8 | 2.631 |
| Decile 7 | 2.409 |
| Decile 6 | 2.23 |
| Median | 2.072 |
| Decile 4 | 1.916 |
| Decile 3 | 1.758 |
| Decile 2 | 1.57 |
| Decile 1 | 1.322 |
| Minimum | -2.119 |
|
|
- Mean = 2.10723
- Std.dev = 0.682718
- 5 items below graph minimum of -0.316
- 84 items above graph maximum of 4.598
|
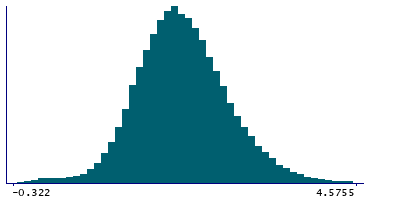
2 Instances
Instance 2 : Imaging visit (2014+)
38,640 participants, 38,640 items
| Maximum | 10.04 |
| Decile 9 | 2.982 |
| Decile 8 | 2.649 |
| Decile 7 | 2.426 |
| Decile 6 | 2.248 |
| Median | 2.089 |
| Decile 4 | 1.933 |
| Decile 3 | 1.77 |
| Decile 2 | 1.581 |
| Decile 1 | 1.328 |
| Minimum | -2.119 |
|
|
- Mean = 2.12185
- Std.dev = 0.687659
- 5 items below graph minimum of -0.326
- 70 items above graph maximum of 4.636
|
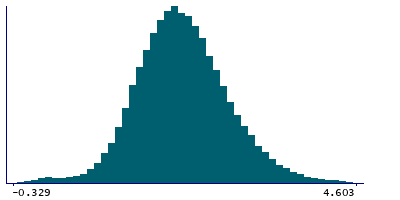
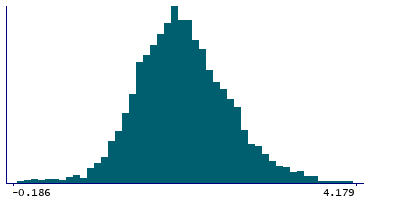
Instance 3 : First repeat imaging visit (2019+)
4,287 participants, 4,287 items
| Maximum | 9.187 |
| Decile 9 | 2.724 |
| Decile 8 | 2.456 |
| Decile 7 | 2.235 |
| Decile 6 | 2.078 |
| Median | 1.937 |
| Decile 4 | 1.8055 |
| Decile 3 | 1.6575 |
| Decile 2 | 1.4865 |
| Decile 1 | 1.269 |
| Minimum | -0.247 |
|
|
- Mean = 1.97547
- Std.dev = 0.621122
- 1 item below graph minimum of -0.186
- 14 items above graph maximum of 4.179
|
Notes
90th percentile of the BOLD (blood-oxygen-level dependent) effect (in group-defined mask) for faces activation (in task fMRI data)
0 Related Data-Fields
There are no related data-fields