Data
48,843 items of data are available, covering 44,314 participants.
Defined-instances run from 2 to 3, labelled using Instancing
2.
Units of measurement are AU.
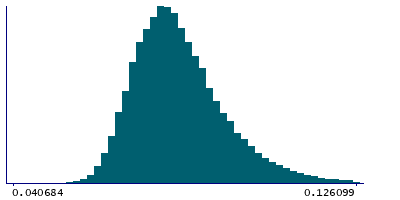
| Maximum | 0.564459 |
| Decile 9 | 0.0971045 |
| Decile 8 | 0.0904115 |
| Decile 7 | 0.086233 |
| Decile 6 | 0.083041 |
| Median | 0.0803315 |
| Decile 4 | 0.077868 |
| Decile 3 | 0.075338 |
| Decile 2 | 0.0725385 |
| Decile 1 | 0.06908 |
| Minimum | 0 |
|
|
- Mean = 0.0821251
- Std.dev = 0.0126303
- 3 items below graph minimum of 0.0410555
- 274 items above graph maximum of 0.125129
|
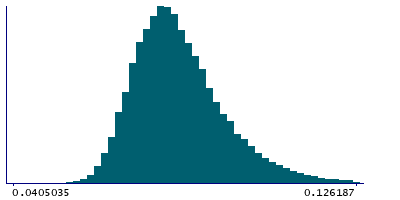
2 Instances
Instance 2 : Imaging visit (2014+)
44,082 participants, 44,082 items
| Maximum | 0.564459 |
| Decile 9 | 0.097031 |
| Decile 8 | 0.0902945 |
| Decile 7 | 0.0861295 |
| Decile 6 | 0.0829065 |
| Median | 0.08019 |
| Decile 4 | 0.077737 |
| Decile 3 | 0.0752225 |
| Decile 2 | 0.072428 |
| Decile 1 | 0.068955 |
| Minimum | 0 |
|
|
- Mean = 0.0820088
- Std.dev = 0.0126004
- 3 items below graph minimum of 0.040879
- 243 items above graph maximum of 0.125107
|
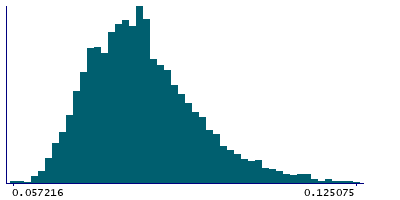
Instance 3 : First repeat imaging visit (2019+)
4,761 participants, 4,761 items
| Maximum | 0.465819 |
| Decile 9 | 0.09765 |
| Decile 8 | 0.0913185 |
| Decile 7 | 0.087238 |
| Decile 6 | 0.0839075 |
| Median | 0.0816345 |
| Decile 4 | 0.0791035 |
| Decile 3 | 0.076527 |
| Decile 2 | 0.0735165 |
| Decile 1 | 0.070246 |
| Minimum | 0.057216 |
|
|
- Mean = 0.0832024
- Std.dev = 0.0128546
- 33 items above graph maximum of 0.125054
|
Notes
Mean OD (orientation dispersion index) in posterior thalamic radiation (right) on FA (fractional anisotropy) skeleton (from dMRI data)
0 Related Data-Fields
There are no related data-fields
0 Resources
There are no matching Resources
