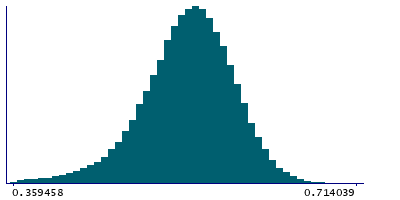
Data
48,843 items of data are available, covering 44,314 participants.
Defined-instances run from 2 to 3, labelled using Instancing
2.
Units of measurement are AU.
| Maximum | 0.99 |
| Decile 9 | 0.59627 |
| Decile 8 | 0.578521 |
| Decile 7 | 0.565342 |
| Decile 6 | 0.553867 |
| Median | 0.543187 |
| Decile 4 | 0.532027 |
| Decile 3 | 0.519604 |
| Decile 2 | 0.503975 |
| Decile 1 | 0.480053 |
| Minimum | 0.229303 |
|
|
- Mean = 0.539652
- Std.dev = 0.0497865
- 245 items below graph minimum of 0.363836
- 37 items above graph maximum of 0.712488
|
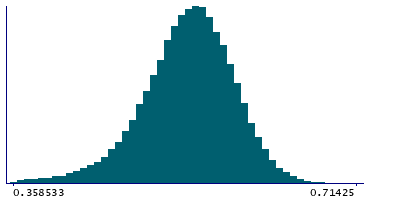
2 Instances
Instance 2 : Imaging visit (2014+)
44,082 participants, 44,082 items
| Maximum | 0.99 |
| Decile 9 | 0.596102 |
| Decile 8 | 0.578408 |
| Decile 7 | 0.565159 |
| Decile 6 | 0.553739 |
| Median | 0.543004 |
| Decile 4 | 0.531777 |
| Decile 3 | 0.519362 |
| Decile 2 | 0.503653 |
| Decile 1 | 0.479606 |
| Minimum | 0.229303 |
|
|
- Mean = 0.539422
- Std.dev = 0.0498904
- 218 items below graph minimum of 0.363109
- 34 items above graph maximum of 0.712599
|
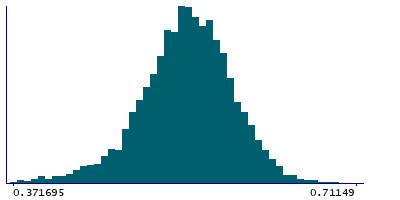
Instance 3 : First repeat imaging visit (2019+)
4,761 participants, 4,761 items
| Maximum | 0.928576 |
| Decile 9 | 0.598206 |
| Decile 8 | 0.579659 |
| Decile 7 | 0.567073 |
| Decile 6 | 0.555547 |
| Median | 0.544703 |
| Decile 4 | 0.534183 |
| Decile 3 | 0.522518 |
| Decile 2 | 0.507119 |
| Decile 1 | 0.484992 |
| Minimum | 0.275962 |
|
|
- Mean = 0.541779
- Std.dev = 0.048763
- 30 items below graph minimum of 0.371777
- 3 items above graph maximum of 0.711421
|
Notes
Mean ICVF (intra-cellular volume fraction) in posterior corona radiata (right) on FA (fractional anisotropy) skeleton (from dMRI data)
0 Related Data-Fields
There are no related data-fields
0 Resources
There are no matching Resources
