Data
48,843 items of data are available, covering 44,314 participants.
Defined-instances run from 2 to 3, labelled using Instancing
2.
Units of measurement are AU.
| Maximum | 0.99 |
| Decile 9 | 0.63591 |
| Decile 8 | 0.612258 |
| Decile 7 | 0.594443 |
| Decile 6 | 0.578557 |
| Median | 0.562877 |
| Decile 4 | 0.545894 |
| Decile 3 | 0.526323 |
| Decile 2 | 0.500433 |
| Decile 1 | 0.461379 |
| Minimum | 0.062765 |
|

|
- Mean = 0.55503
- Std.dev = 0.0705142
- 86 items below graph minimum of 0.286847
- 30 items above graph maximum of 0.810441
|
2 Instances
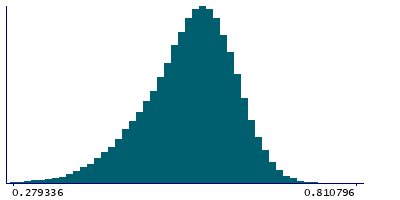
Instance 2 : Imaging visit (2014+)
44,082 participants, 44,082 items
| Maximum | 0.99 |
| Decile 9 | 0.636143 |
| Decile 8 | 0.612603 |
| Decile 7 | 0.594786 |
| Decile 6 | 0.578958 |
| Median | 0.563225 |
| Decile 4 | 0.54636 |
| Decile 3 | 0.526604 |
| Decile 2 | 0.50061 |
| Decile 1 | 0.461279 |
| Minimum | 0.062765 |
|
|
- Mean = 0.555301
- Std.dev = 0.0706967
- 79 items below graph minimum of 0.286415
- 28 items above graph maximum of 0.811007
|
Instance 3 : First repeat imaging visit (2019+)
4,761 participants, 4,761 items
| Maximum | 0.99 |
| Decile 9 | 0.632831 |
| Decile 8 | 0.608769 |
| Decile 7 | 0.59136 |
| Decile 6 | 0.575118 |
| Median | 0.5589 |
| Decile 4 | 0.54256 |
| Decile 3 | 0.523757 |
| Decile 2 | 0.499014 |
| Decile 1 | 0.463547 |
| Minimum | 0.137649 |
|

|
- Mean = 0.552516
- Std.dev = 0.0687513
- 7 items below graph minimum of 0.294262
- 2 items above graph maximum of 0.802116
|
Notes
Mean ICVF (intra-cellular volume fraction) in fornix on FA (fractional anisotropy) skeleton (from dMRI data)
0 Related Data-Fields
There are no related data-fields
0 Resources
There are no matching Resources
