Data
48,846 items of data are available, covering 44,317 participants.
Defined-instances run from 2 to 3, labelled using Instancing
2.
Units of measurement are AU.
| Maximum | 0.001977 |
| Decile 9 | 0.001238 |
| Decile 8 | 0.001218 |
| Decile 7 | 0.001204 |
| Decile 6 | 0.001191 |
| Median | 0.00118 |
| Decile 4 | 0.001168 |
| Decile 3 | 0.001156 |
| Decile 2 | 0.001142 |
| Decile 1 | 0.001122 |
| Minimum | 0 |
|

|
- Mean = 0.00117981
- Std.dev = 4.72379e-05
- 23 items below graph minimum of 0.001006
- 30 items above graph maximum of 0.001354
|
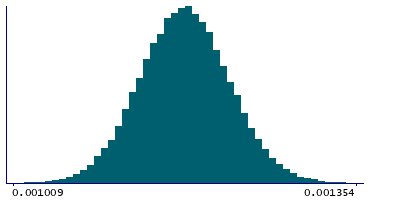
2 Instances
Instance 2 : Imaging visit (2014+)
44,085 participants, 44,085 items
| Maximum | 0.001977 |
| Decile 9 | 0.00124 |
| Decile 8 | 0.00122 |
| Decile 7 | 0.001205 |
| Decile 6 | 0.001193 |
| Median | 0.001181 |
| Decile 4 | 0.00117 |
| Decile 3 | 0.001158 |
| Decile 2 | 0.001143 |
| Decile 1 | 0.001124 |
| Minimum | 0 |
|
|
- Mean = 0.00118166
- Std.dev = 4.7241e-05
- 24 items below graph minimum of 0.001008
- 25 items above graph maximum of 0.001356
|
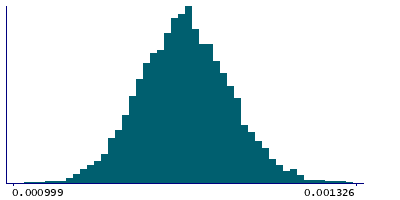
Instance 3 : First repeat imaging visit (2019+)
4,761 participants, 4,761 items
| Maximum | 0.001458 |
| Decile 9 | 0.001217 |
| Decile 8 | 0.001198 |
| Decile 7 | 0.001185 |
| Decile 6 | 0.001172 |
| Median | 0.001162 |
| Decile 4 | 0.001151 |
| Decile 3 | 0.001139 |
| Decile 2 | 0.001126 |
| Decile 1 | 0.001108 |
| Minimum | 0.000997 |
|
|
- Mean = 0.00116267
- Std.dev = 4.3627e-05
- 1 item below graph minimum of 0.000999
- 4 items above graph maximum of 0.001326
|
Notes
Mean L1 in middle cerebellar peduncle on FA (fractional anisotropy) skeleton (from dMRI data)
0 Related Data-Fields
There are no related data-fields
0 Resources
There are no matching Resources
