Data
48,846 items of data are available, covering 44,317 participants.
Defined-instances run from 2 to 3, labelled using Instancing
2.
Units of measurement are AU.
| Maximum | 0.00314 |
| Decile 9 | 0.001226 |
| Decile 8 | 0.001139 |
| Decile 7 | 0.001088 |
| Decile 6 | 0.00105 |
| Median | 0.001017 |
| Decile 4 | 0.000989 |
| Decile 3 | 0.000961 |
| Decile 2 | 0.00093 |
| Decile 1 | 0.000891 |
| Minimum | 0 |
|
|
- Mean = 0.00104362
- Std.dev = 0.000143671
- 4 items below graph minimum of 0.000556
- 333 items above graph maximum of 0.001561
|
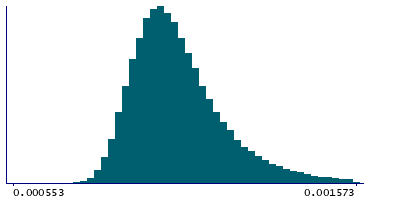
2 Instances
Instance 2 : Imaging visit (2014+)
44,085 participants, 44,085 items
| Maximum | 0.00314 |
| Decile 9 | 0.001227 |
| Decile 8 | 0.00114 |
| Decile 7 | 0.001089 |
| Decile 6 | 0.001051 |
| Median | 0.001019 |
| Decile 4 | 0.00099 |
| Decile 3 | 0.000962 |
| Decile 2 | 0.000931 |
| Decile 1 | 0.000893 |
| Minimum | 0 |
|

|
- Mean = 0.00104474
- Std.dev = 0.00014381
- 4 items below graph minimum of 0.000559
- 305 items above graph maximum of 0.001561
|
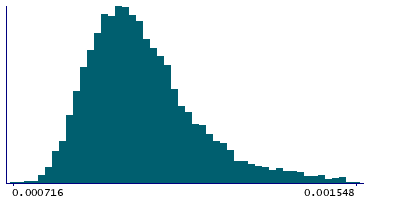
Instance 3 : First repeat imaging visit (2019+)
4,761 participants, 4,761 items
| Maximum | 0.001922 |
| Decile 9 | 0.001215 |
| Decile 8 | 0.001127 |
| Decile 7 | 0.001078 |
| Decile 6 | 0.001039 |
| Median | 0.001008 |
| Decile 4 | 0.00098 |
| Decile 3 | 0.00095 |
| Decile 2 | 0.00092 |
| Decile 1 | 0.000882 |
| Minimum | 0.000716 |
|
|
- Mean = 0.00103319
- Std.dev = 0.000141954
- 29 items above graph maximum of 0.001548
|
Notes
Mean MD (mean diffusivity) in tapetum (right) on FA (fractional anisotropy) skeleton (from dMRI data)
0 Related Data-Fields
There are no related data-fields
0 Resources
There are no matching Resources
