Data
48,846 items of data are available, covering 44,317 participants.
Defined-instances run from 2 to 3, labelled using Instancing
2.
Units of measurement are AU.
| Maximum | 0.003548 |
| Decile 9 | 0.0020205 |
| Decile 8 | 0.001818 |
| Decile 7 | 0.0017 |
| Decile 6 | 0.001612 |
| Median | 0.001539 |
| Decile 4 | 0.001472 |
| Decile 3 | 0.001407 |
| Decile 2 | 0.001339 |
| Decile 1 | 0.001253 |
| Minimum | 0.000697 |
|
|
- Mean = 0.00159986
- Std.dev = 0.000322366
- 214 items above graph maximum of 0.002788
|
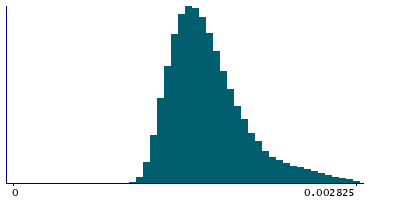
2 Instances
Instance 2 : Imaging visit (2014+)
44,085 participants, 44,085 items
| Maximum | 0.003548 |
| Decile 9 | 0.002021 |
| Decile 8 | 0.001818 |
| Decile 7 | 0.0017 |
| Decile 6 | 0.001612 |
| Median | 0.001539 |
| Decile 4 | 0.001471 |
| Decile 3 | 0.001406 |
| Decile 2 | 0.001339 |
| Decile 1 | 0.001252 |
| Minimum | 0.000697 |
|

|
- Mean = 0.00159988
- Std.dev = 0.000322517
- 193 items above graph maximum of 0.00279
|
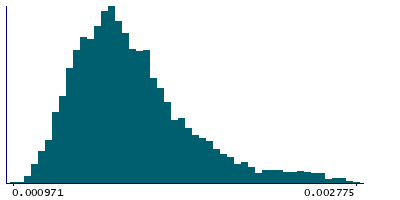
Instance 3 : First repeat imaging visit (2019+)
4,761 participants, 4,761 items
| Maximum | 0.003096 |
| Decile 9 | 0.0020155 |
| Decile 8 | 0.001813 |
| Decile 7 | 0.0016935 |
| Decile 6 | 0.001612 |
| Median | 0.001538 |
| Decile 4 | 0.001475 |
| Decile 3 | 0.001412 |
| Decile 2 | 0.00134 |
| Decile 1 | 0.001257 |
| Minimum | 0.000971 |
|
|
- Mean = 0.00159973
- Std.dev = 0.000320968
- 20 items above graph maximum of 0.002774
|
Notes
Mean MD (mean diffusivity) in fornix on FA (fractional anisotropy) skeleton (from dMRI data)
0 Related Data-Fields
There are no related data-fields
0 Resources
There are no matching Resources
