Data
50,073 items of data are available, covering 46,626 participants.
Defined-instances run from 2 to 3, labelled using Instancing
2.
Units of measurement are g/cm2.
| Maximum | 1.98787 |
| Decile 9 | 1.19882 |
| Decile 8 | 1.12488 |
| Decile 7 | 1.07229 |
| Decile 6 | 1.02759 |
| Median | 0.986404 |
| Decile 4 | 0.946764 |
| Decile 3 | 0.905108 |
| Decile 2 | 0.85818 |
| Decile 1 | 0.795566 |
| Minimum | 0 |
|
|
- Mean = 0.993789
- Std.dev = 0.157184
- 22 items above graph maximum of 1.60208
|
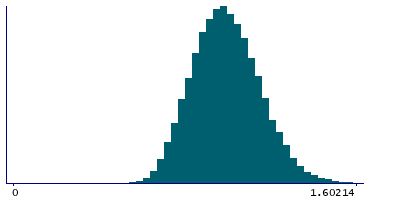
2 Instances
Instance 2 : Imaging visit (2014+)
46,170 participants, 46,170 items
| Maximum | 1.98787 |
| Decile 9 | 1.20003 |
| Decile 8 | 1.1256 |
| Decile 7 | 1.07288 |
| Decile 6 | 1.02786 |
| Median | 0.986642 |
| Decile 4 | 0.947134 |
| Decile 3 | 0.905434 |
| Decile 2 | 0.85844 |
| Decile 1 | 0.795727 |
| Minimum | 0 |
|

|
- Mean = 0.994277
- Std.dev = 0.157556
- 21 items above graph maximum of 1.60434
|
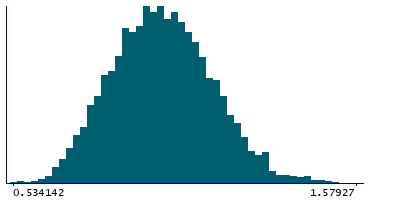
Instance 3 : First repeat imaging visit (2019+)
3,903 participants, 3,903 items
| Maximum | 1.59081 |
| Decile 9 | 1.18627 |
| Decile 8 | 1.11653 |
| Decile 7 | 1.06654 |
| Decile 6 | 1.0245 |
| Median | 0.984361 |
| Decile 4 | 0.943686 |
| Decile 3 | 0.901346 |
| Decile 2 | 0.855254 |
| Decile 1 | 0.793277 |
| Minimum | 0.534142 |
|
|
- Mean = 0.988017
- Std.dev = 0.152589
- 3 items above graph maximum of 1.57927
|