Data
573,052 items of data are available, covering 492,970 participants.
Defined-instances run from 0 to 3, labelled using Instancing
2.
Units of measurement are Kg.
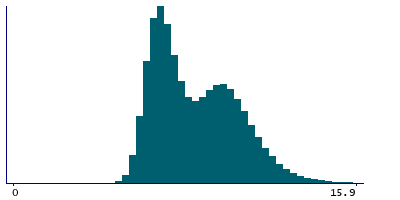
| Maximum | 23.1 |
| Decile 9 | 11.1 |
| Decile 8 | 10.2 |
| Decile 7 | 9.5 |
| Decile 6 | 8.8 |
| Median | 8.1 |
| Decile 4 | 7.5 |
| Decile 3 | 7 |
| Decile 2 | 6.7 |
| Decile 1 | 6.3 |
| Minimum | 2.2 |
|
|
- Mean = 8.44205
- Std.dev = 1.91581
- 596 items above graph maximum of 15.9
|
4 Instances
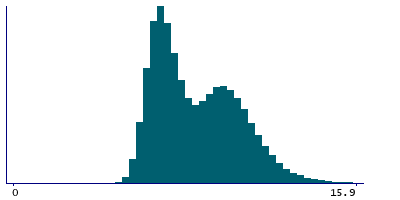
Instance 0 : Initial assessment visit (2006-2010) at which participants were recruited and consent given
492,169 participants, 492,169 items
| Maximum | 23.1 |
| Decile 9 | 11.1 |
| Decile 8 | 10.3 |
| Decile 7 | 9.6 |
| Decile 6 | 8.9 |
| Median | 8.1 |
| Decile 4 | 7.5 |
| Decile 3 | 7.1 |
| Decile 2 | 6.7 |
| Decile 1 | 6.3 |
| Minimum | 2.2 |
|
|
- Mean = 8.48652
- Std.dev = 1.92729
- 538 items above graph maximum of 15.9
|
Instance 1 : First repeat assessment visit (2012-13)
20,041 participants, 20,041 items
| Maximum | 18.9 |
| Decile 9 | 10.8 |
| Decile 8 | 10 |
| Decile 7 | 9.4 |
| Decile 6 | 8.8 |
| Median | 8.1 |
| Decile 4 | 7.4 |
| Decile 3 | 7 |
| Decile 2 | 6.6 |
| Decile 1 | 6.2 |
| Minimum | 4.3 |
|
|
- Mean = 8.32243
- Std.dev = 1.8278
- 24 items above graph maximum of 15.4
|
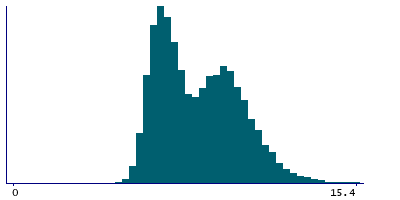
Instance 2 : Imaging visit (2014+)
55,673 participants, 55,673 items
| Maximum | 19.4 |
| Decile 9 | 10.6 |
| Decile 8 | 9.8 |
| Decile 7 | 9.2 |
| Decile 6 | 8.5 |
| Median | 7.9 |
| Decile 4 | 7.2 |
| Decile 3 | 6.8 |
| Decile 2 | 6.4 |
| Decile 1 | 6 |
| Minimum | 4.4 |
|
|
- Mean = 8.12767
- Std.dev = 1.81874
- 67 items above graph maximum of 15.2
|
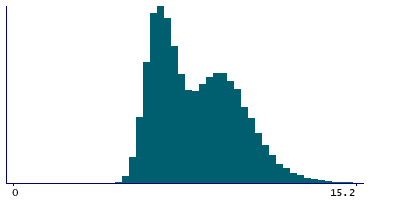
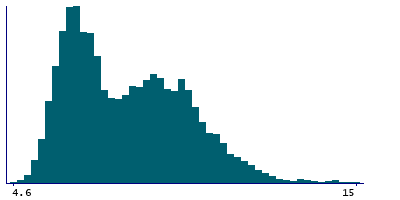
Instance 3 : First repeat imaging visit (2019+)
5,169 participants, 5,169 items
| Maximum | 17.1 |
| Decile 9 | 10.5 |
| Decile 8 | 9.7 |
| Decile 7 | 9 |
| Decile 6 | 8.5 |
| Median | 7.8 |
| Decile 4 | 7.1 |
| Decile 3 | 6.7 |
| Decile 2 | 6.4 |
| Decile 1 | 6 |
| Minimum | 4.6 |
|
|
- Mean = 8.05773
- Std.dev = 1.78753
- 4 items above graph maximum of 15
|


