Data
46,956 items of data are available, covering 46,253 participants.
Defined-instances run from 2 to 3, labelled using Instancing
2.
Units of measurement are seconds.
| Maximum | 5278 |
| Decile 9 | 498 |
| Decile 8 | 398 |
| Decile 7 | 339 |
| Decile 6 | 294 |
| Median | 258 |
| Decile 4 | 228 |
| Decile 3 | 200 |
| Decile 2 | 175 |
| Decile 1 | 148 |
| Minimum | 13 |
|

|
- There are 1184 distinct values.
- Mean = 298.335
- Std.dev = 171.588
- 682 items above graph maximum of 848
|
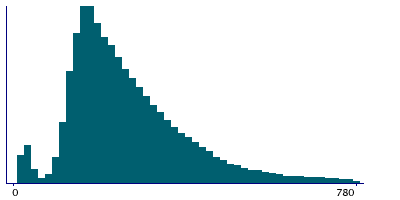
2 Instances
Instance 2 : Imaging visit (2014+)
40,004 participants, 40,004 items
| Maximum | 5278 |
| Decile 9 | 496 |
| Decile 8 | 401 |
| Decile 7 | 344 |
| Decile 6 | 300 |
| Median | 263 |
| Decile 4 | 232 |
| Decile 3 | 204 |
| Decile 2 | 178 |
| Decile 1 | 149 |
| Minimum | 13 |
|
|
- There are 1153 distinct values.
- Mean = 300.847
- Std.dev = 170.157
- 583 items above graph maximum of 843
|
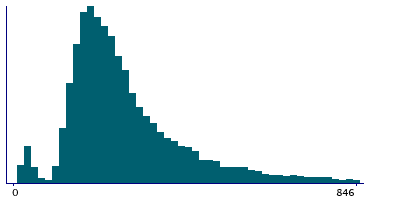
Instance 3 : First repeat imaging visit (2019+)
6,952 participants, 6,952 items
| Maximum | 2340 |
| Decile 9 | 505.5 |
| Decile 8 | 379 |
| Decile 7 | 304 |
| Decile 6 | 261 |
| Median | 233 |
| Decile 4 | 207 |
| Decile 3 | 185 |
| Decile 2 | 164 |
| Decile 1 | 139 |
| Minimum | 13 |
|
|
- There are 830 distinct values.
- Mean = 283.882
- Std.dev = 178.917
- 104 items above graph maximum of 872
|
Notes
Sample collection duration
0 Related Data-Fields
There are no related data-fields
0 Resources
There are no matching Resources
