Data
72,940 items of data are available, covering 68,223 participants.
Defined-instances run from 2 to 3, labelled using Instancing
2.
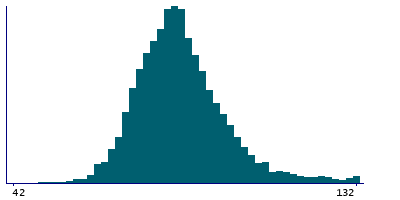
Units of measurement are ms.
| Maximum | 356 |
| Decile 9 | 104 |
| Decile 8 | 96 |
| Decile 7 | 92 |
| Decile 6 | 88 |
| Median | 86 |
| Decile 4 | 84 |
| Decile 3 | 80 |
| Decile 2 | 78 |
| Decile 1 | 74 |
| Minimum | 6 |
|
|
- There are 90 distinct values.
- Mean = 88.2443
- Std.dev = 14.7378
- 10 items below graph minimum of 44
- 1502 items above graph maximum of 134
|
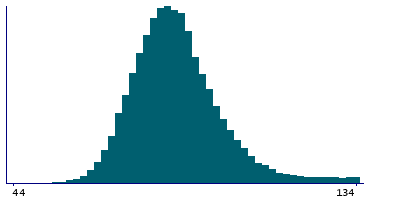
2 Instances
Instance 2 : Imaging visit (2014+)
67,741 participants, 67,741 items
| Maximum | 356 |
| Decile 9 | 104 |
| Decile 8 | 96 |
| Decile 7 | 92 |
| Decile 6 | 88 |
| Median | 86 |
| Decile 4 | 84 |
| Decile 3 | 80 |
| Decile 2 | 78 |
| Decile 1 | 74 |
| Minimum | 6 |
|
|
- There are 87 distinct values.
- Mean = 88.2823
- Std.dev = 14.724
- 9 items below graph minimum of 44
- 1392 items above graph maximum of 134
|
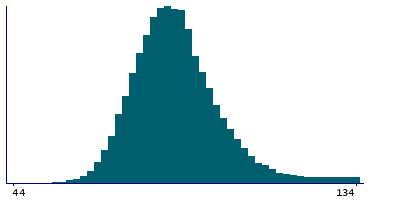
Instance 3 : First repeat imaging visit (2019+)
5,199 participants, 5,199 items
| Maximum | 236 |
| Decile 9 | 102 |
| Decile 8 | 96 |
| Decile 7 | 92 |
| Decile 6 | 88 |
| Median | 86 |
| Decile 4 | 82 |
| Decile 3 | 80 |
| Decile 2 | 78 |
| Decile 1 | 74 |
| Minimum | 8 |
|
|
- There are 68 distinct values.
- Mean = 87.7503
- Std.dev = 14.9084
- 1 item below graph minimum of 46
- 135 items above graph maximum of 130
|
Notes
QRS duration during ECG measurement
0 Related Data-Fields
There are no related data-fields